


Non-fatal workplace injuries and illnesses among private industry employers declined in 2009 to a rate of 3.6 cases per 100 equivalent full-time workers — down from 3.9 cases in 2008. The total recordable case injury and illness incidence rate among private industry employers has declined significantly each year since 2003, when these estimates were first published.
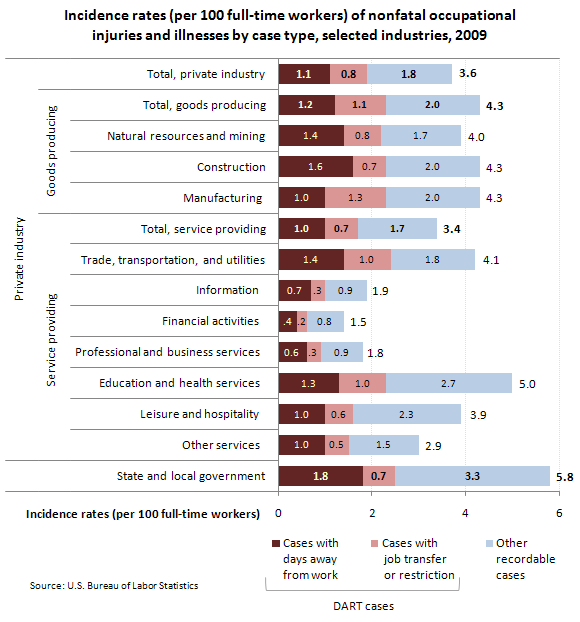
Slightly more than one-half of the private industry injury and illness cases reported nationally in 2009 were of a more serious nature that involved days away from work, job transfer, or restriction (commonly referred to as DART cases). These occurred at a rate of 1.8 cases per 100 workers, declining from 2.0 cases in 2008. Among the two components of DART cases, the rate of cases requiring job transfer or restriction fell from 0.9 to 0.8 cases per 100 workers, while the rate for cases involving days away from work remained relatively unchanged in 2009 (1.1 cases) at the level of rounding presented in this news release. (Components do not sum to total due to rounding.)
The manufacturing industry sector reported the largest year-to-year decline in injuries and illnesses since these estimates were first published in 2003 — lowering the incidence rate by 0.7 cases to 4.3 cases per 100 workers. Manufacturing was the only private industry sector in 2009 in which the rate of job transfer or restriction cases exceeded the rate of cases with days away from work, continuing a 12-year trend.
The incidence rate in the construction industry sector also declined in 2009, compared to 2008 — lowering by 0.4 cases to 4.3 cases per 100 workers.
Among state and local government workers, the workplace injuries and illnesses incidence rate was 5.8 cases per 100 workers — significantly higher than the rate among private industry workers (3.6 cases per 100 workers), but lower than the rate (6.3 cases) reported among these public sector workers in 2008.
This earnings data is from the Injuries, Illnesses, and Fatalities program. To learn more, see "Workplace Injuries and Illnesses — 2009" (HTML) (PDF), news release USDL–10–1451.
