Failure Analysis Tools: Choosing the Right One for the Job
Tags: root cause analysis, maintenance and reliability, IIoT
There are a variety of failure analysis and problem-solving methods used to analyze equipment and process failures. The different methods are described and compared so maintenance and reliability professionals can select the right failure analysis or problem-solving tool to produce the best solution at the lowest cost.
Who would you want to work on your equipment? The person who selects the right tool(s) from a well-equipped toolbox and skillfully uses them to complete the job quickly without errors or one who has a few basic tools but struggles to complete the job on time and without errors.
What tool will work best, a micrometer or a clamp? A micrometer is required to measure a bearing fit, but a C clamp may be needed when welding two pieces of steel together.
Your mental toolbox should also contain a variety of analysis tools. You must select the analysis method best suited for solving the problem at hand. Remember, each tool has its own strengths, weaknesses and preferred area of application.
Problems and failures occur every day. Usually we only have the time and resources to provide relief. Not every problem warrants a root cause analysis.
Our job is to separate problems and failures that require relief from those where we need to prevent occurrence in the future. To help separate these, ask yourself a few questions:
-
What is the current actual impact of the problem?
-
What is the potential impact if the problem is not solved?
-
What level of risk can we live with that is supported from a moral/legal/contractual viewpoint?
-
What is an acceptable outcome that balances risk, cost and benefits?
When we focus on a response that provides needed relief and, as necessary, the discovery of root causes, we become more productive.
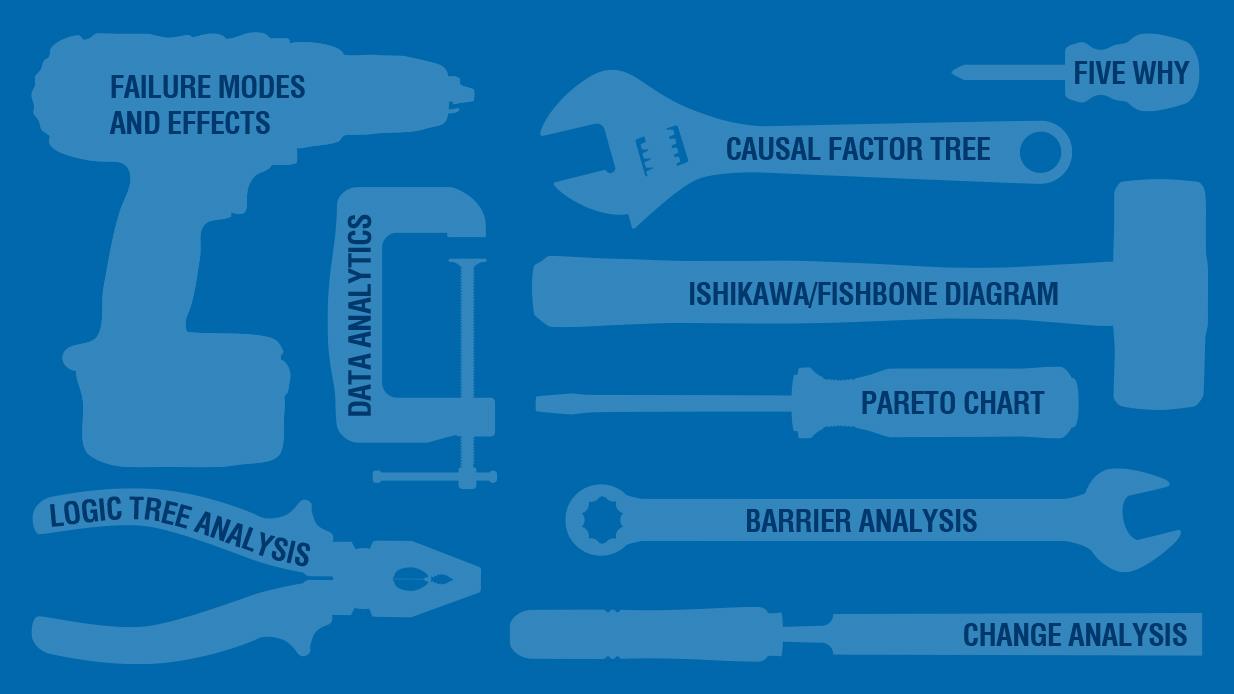
Let’s look at some of the root cause analysis tools available, including their strengths and weakness, so you can select and use the one to gain the insight you need to solve your problems.
Root cause analysis (RCA) is not a single well-defined method; there are many different processes and methods for performing RCA analysis that are defined by their approach or field of origin:
-
Safety – accident analysis, occupational safety and health
-
Production – quality control in industrial manufacturing
-
Process – the scope of production is expanded to include business practices
-
Equipment failure – inspired by the military then customized by industry and used in engineering and maintenance
-
Systems – incorporates all the above and adds management of change
A search of “root cause analysis” will produce dozens of results. Unfortunately, there are not uniform definitions, so a fundamental method or process may have several different names and descriptions. These methods vary in scope and complexity. It is as important to use the right analysis method, so it matches the scope and complexity of the problem.
Some of the common root cause analysis (RCA) techniques are:
-
Five why – Asks why, why, why until fundamental causes are identified.
-
Ishikawa/fishbone diagram – Causes and effects are listed in categories.
-
Cause and effect analysis/Causal factor tree – The causal factors are displayed on a tree so that cause-effect dependencies can be identified.
-
Failure modes and effects/criticality analysis – Possible failure modes are defined; the effects and probabilities of those failures are described to identify appropriate countermeasures beginning with the most critical equipment.
-
Fault or logic tree analysis – A failure is identified and the failure modes are described and tested until the roots are identified.
-
Barrier analysis – Examines pathways through which a hazard can affect a target and barriers in the pathways.
-
Change analysis/Kepner-Tregoe – Comparing a situation that does not exhibit a problem to one that does in order to identify the changes or differences that explain what happened.
-
Pareto chart – Shows the relative frequency of problems or failures in rank-order so that process improvement activities can be focused on the significant few.
-
Data analytics – Is a process of transforming and modeling data with the goal of discovering useful information.
Next, let’s describe each of these methods in more detail and explain their advantages and limitations.
Five Whys
Five whys is a questioning technique used to determine the cause and effects of a specific problem or failure. It asks why. The answer forms the basis for the next question. You keep going until you get to something fundamental or completely outside your control. The number five is based on the observation that asking “why” five times typically resolves the problem. It may take only three iterations, or you may still be asking “why” a month from now. It depends on the problem.

Figure 1. Five whys scenario
Not all failures have a single root cause. To determine additional causes, the questioning must be repeated beginning with a different observation.
Advantages
It does not take a large group to complete the analysis. Frequently, one or two people are sufficient. For component failures, the mechanics, chemistry and physics are well-defined, so it works best at this level. It does not work as well for human and organizational causes.
The method is flexible without rules about what lines of questions to explore or how long to search for additional root causes. Consequently, the outcome depends upon the knowledge and persistence of the people involved.
Limitations
This method is based on the concept that every effect has a single cause. If multiple causes can result in the same effect or a combination of causes are necessary to produce an effect, these may be overlooked. It’s rare that a single cause at each level of why is sufficient to explain the effect in question.
When multiple path five whys are used, there may be more than one answer to some of the whys, and it is very easy for the analysis to become too complex. To address this problem, causal factor tree analysis was developed. If one of your answers is wrong, it may have been possible, but was not an actual cause and was something else entirely.
Ishikawa/Fishbone Diagram
The Ishikawa/fishbone diagram (Figure 2) is a graphical tool used to identify potential root causes and what category of process inputs represents the greatest source of variability in the output. A completed fishbone diagram includes a central spine and branches resembling a fish skeleton. The branches are used to categorize the causes, either by process sequence or function. In each category, the potential causes are listed and then tested for validity using evidence or another analytical tool.

Figure 2. Ishikawa/Fishbone Diagram
Advantages
A fishbone diagram is useful in that it shows relationships between potential causes and is a good way to involve people in problem-solving. It is also effective when used by a single person.
Limitations
Involving multiple people in a fishbone diagram can limit its effectiveness, because it encourages a divergent approach where the temptation to identify and fix everything that might cause the problem is strong. For a fishbone diagram to be successful, a ruthless culling of causes that are not sufficient, necessary or exist to result in the problem is required.
Cause-and-Effect Analysis/Causal Factor Tree
A cause-and-effect analysis combines the question used in five whys with the tree structure of a logic or fault tree. It helps to think of it as an expansion of the five whys method in a logic tree format. It can examine multiple causes on a single effect.
The problem, failure or deviation (the effect) is placed at the top of the tree or a single item at the left of a page. By asking “why,” factors that were immediate causes of this effect are displayed below it and linked using branches. These causes are tested for necessity, sufficiency and existence. Causes that do not meet this test are removed from the tree.
Next, immediate causes of each of these factors is added. Every cause added to the structure must meet the same requirements for necessity, sufficiency and existence.
Some analysts begin with a problem statement answering who, what, when and where and followed by a list of goals the event impacted. Then a causal factor tree is developed for each of the impacted goals. This simultaneous construction helps reveal gaps in knowledge.
Causal factor trees usually have many endpoints. Endpoints that require corrective action are root causes.
Several advantages result from constructing a causal factor tree:
-
Provides a structure for recording causes and evidence that is easy to follow.
-
Can handle multiple scenarios.
-
Works well as a master analysis technique.
-
Can incorporate results from other tools.
Causal factor trees also have limitations:
-
It is difficult to handle and display time-dependent events.
-
Complexity makes it harder to treat sequence dependencies.
-
Will identify knowledge gaps, but does not have a means of filling them in.
-
Stopping points may be arbitrary.
In the causal factor tree example in Figure 3, there are multiple potential causes for a single effect. In the third row from the bottom, two causes were present which resulted in the endurance strength of the material being exceeded. First was a stress concentration caused by wear of a bearing fit on the shaft. Second was increased belt tension caused by increasing the speed of the machine several months prior to the failure. Although either one could have been a cause, the presence of both accelerated the fatigue fracture of the shaft. These resulted in a catastrophic failure of the drive when the shaft fractured.

Figure 3. Paper machine dryer section causal factor tree
Failure Modes and Effects Analysis
Failure modes and effects analysis (FMEA) is by far the most comprehensive and complex root cause analysis tool available. It may be combined with criticality analysis or fault tree analysis to further identify failure modes with the greatest probability severity of consequences. It is an inductive process that may be started at the component level (shaft, bearing gear, etc.) or at the functional level (charge pumps, press hydraulics, etc.).
FMEA is a high-level, detailed, “what if” analysis of a problem. A basic “what if” analysis is shown in Figure 4. It includes a brainstorming method using “what if” questions to identify possible variations and flaws in a system. Once identified, these concerns and their potential consequences are evaluated for risk.

Figure 4. A simple “what if” statement
It helps to think of the FMEA process as a very detailed and rigorous “what if” process.
FMEA analysis starts with a definition of the system to be studied and progresses through a series of steps until a correction is made and follow-up to assess its effectiveness is completed. FMEA was developed to evaluate the impact of component failures in a system. It is used to identify where a failure could occur (failure mode) and the impact of such a failure (effects).
Advantages
FMEA is most useful in contingency planning where it is used to evaluate the impact of various possible failures (contingencies). The FMEA can be used in place of a “what if” analysis should greater detail be needed.
When combined with criticality analysis, the analysis will systematically establish relationships between failure causes and effects, as well as the probability of occurrence, and will point out individual failure modes for corrective action. When FMEA is used to complement fault tree analysis, more failure modes and causes may be identified.
Limitations
FMEA is widely used in aviation and some industries, but it has the following limitations:
-
The time and effort required to complete the analysis
-
Dilution of the effort with inconsequential cases
-
Inability to deal with combined failure events
-
Does not typically include human interactions
-
It examines hazards associated with failures, not one during normal operation
Fault or Logic Tree Analysis
A fault or logic tree is a process to discover the physical, human and latent roots of a failure. It begins with a problem statement describing the failure. Accurate description of the failure is critical to the success of logic tree construction. Failure descriptions arefunctional orcomponent.
Functional failures describe a variation from a desired state, such as the pump does not supply the required pressure or is unable to maintain design speed without elevated vibration. They should be described quantitatively. The fault tree analysis in Figure 4 starts with a functional failure of a pump; there is no flow from the pump. If the pump was capable of producing some flow, the flow or pressure should be included.
Component failures describe the state of a specific component. In this case, the analysis would begin with a statement, such as the gearbox shaft fractured or the outboard conveyor bearing failed.
The second step lists failure modes just below the failure description. A common mistake is listing every possible failure mode. Discernment is needed to list those relevant to the failure. For example, fracture is a failure mode of a bearing, but if the bearing is not fractured, it will not be a failure mode. It is helpful to ask, “How can …?”
A hypothesis for each mode is made, and then each hypothesis is tested using the evidence. If the evidence cannot support the hypothesis, the hypothesis is not used.
This process is repeated until the physical roots are reached. Additional iterations will be required to arrive at the human and latent roots. One must ask, “How can….?” followed by “What does the evidence confirm?” Remember, each hypothesis must be tested and verified with evidence. This is where many root cause analysis efforts get into trouble.
Advantages
Fault tree analysis is very good at showing how resistant a system is to single or multiple initiating faults. It can start at a functional or component level. OSHA recognizes fault tree analysis as an acceptable method for process hazard analysis in its process safety management standard.
Limitations
Fault and logic trees require careful problem definition. Depending on the problem definition, it does not always find all possible initiating faults. If the scope of the problem is too large, the process becomes bogged down in analysis of non-consequential elements, and it becomes a scatter gun approach to try and address roots that are not causal to the failure.
The example in Figure 5 is a logic tree for a pump that stopped pumping. Disassembly of the pump revealed a fractured shaft. The fatigue fracture causing the pump to fail started at a stress concentration. This was the physical root. Further investigation found the pump shaft had been made from a print that did not specify radii in critical locations. The omission of radii was the one of the human roots. The print of the pump shaft had been made as a cost-cutting measure, so pump shafts could be made by the lowest cost bidder. The effort to cut costs was one of the organizational or latent roots.

Figure 5. Fault tree analysis of a pump functional failure
Barrier Analysis
Barrier analysis examines the pathways through which a hazard can affect a target. It identifies the actual or potential barriers or controls used to protect the target. The target must exist within a specified set of conditions. The idea of a target means that most anything can be a target — a piece of equipment, data, building or person.
Next, the means by which a target is adversely affected is called a hazard. An adverse effect is anything that shifts a target outside its specified set of conditions. It then becomes possible to uniquely identify target and hazard pairs by the pathway through which hazards affect targets.
Once the hazards, targets and pathways through which hazards affect targets are identified, controls and barriers used to protect, mitigate damage to, and/or maintain a target within a specified set of conditions can be described.
Barriers and controls are usually designed into systems to protect people, equipment, data, etc. All hazards may not be identified during design or unrecognized pathways exist. The existing barriers and controls may not be present, or even if they are, they may not be as effective as originally intended. Consequently, targets may lack adequate protection.
The purpose of barrier analysis is to identify unprotected pathways or barriers and controls that are no longer effective. Historically, energy that can cause harm has been used to characterize pathways. Pathways can include electrical, mechanical, fluid, chemical, heat, radiation, etc. Consequently, barriers and controls have been physical or relate to physical harm.
The barrier analysis in Figure 6 is a typical lubrication monitoring system found on many turbines. The hazard is loss of a fluid film bearing from insufficient oil flow. Prevention barriers include instrumentation to monitor temperatures, flow and reservoir oil level. In addition to the monitoring, additional barriers of standby and emergency oil pumps are used. Mitigation begins when an alarm level is exceeded, requiring operator intervention. The final barrier would be an emergency turbine shutdown that could be triggered by bearing temperature and loss of oil flow.
Change in the target’s condition, physical or non-physical, could be detrimental or unwanted. Now, consideration of mechanisms other than the physical directs attention into areas that are more knowledge, software, policy or administrative-based.
Advantages
Barrier analysis has the advantage of being conceptually simple, easy to use, requiring minimal resources and working well with other root cause analysis methods. Results of the analysis are readily translated into corrective actions.
Limitations
However, barrier analysis is subjective in nature. No two analysts are the same and will not always reach the same or similar conclusions. It is also easy to confuse causes and countermeasures, so it should not be used as a single method for determining root causes.

Figure 6. Barrier analysis of turbine lubrication monitoring system
Change Analysis/Kepner-Tregoe
Change analysis compares a specification of a single problem or event to a desired situation so changes and/or differences may be found by comparing them. The desired situation may be a task or operation that had been done correctly before, a similar task or operation, or a detailed model or simulation of the task or operation.
The potential causes are studied, and those requiring the fewest additional assumptions or conditions are tested to verify which are the true cause(s). Success depends on the accuracy of the deviation specification and verification testing.
Advantages of change analysis are:
- The ability to find important direct causes that are unclear or hidden.
- Analysis results migrate easily into corrective actions.
- It is complementary to other methods.
- It works best for analyzing functional failures.
Limitations of change analysis are:
- There must be a basis for comparison.
- It works only for a single, specific deviation.
- It only identifies direct causes for a deviation.
- The results may not be conclusive, and testing will be required.
Kepner-Tregoe is an enhanced change analysis that uses four categories (who, where, when and extent) and two filters (is and is not) to develop a list of characteristics that describe the deviated condition. Each deviated characteristic or combination of them becomes a potential cause of the overall deviated condition. In the Kepner-Tregoe system, change analysis is called problem analysis. This is one of three tools used to evaluate a problem.
The Kepner-Tregoe process typically begins with a situation appraisal to clarify the problem situation (what happened) and then uses one of the following subsets to complete the analysis. The relationship of these methods is shown in Figure 7.
-
Problem analysis: Here the actual cause of the problem and the relationship between cause and result are searched for (why did it happen).
-
Decision analysis: Based on the decision-making criteria, choices are made to arrive at potential problem resolutions (how should we act).
-
Potential problem analysis: Potential future problems are anticipated, and preventative actions are developed (what will the result be).

Figure 7. The Kepner-Tregoe model
Statistical Tools
There are dozens of statistical methods and tools available. They are commonly used to describe process and product variations. Statistical information is useful to identify trends of equipment performance such as mean time between failure (MTBF), mean time to repair (MTTR), schedule compliance, work order backlog, work order age, etc. Statistical tools are typically not thought of as a failure analysis tool, but their importance in identifying trends and deviations from a desired outcome are critical for a successful maintenance effort. One important statistical tool that is frequently used in equipment failure analysis is the Pareto chart.
Pareto Analysis
The Pareto theory was developed by Italian economist Vilfredo Pareto in 1897 to explain the uneven distribution of wealth. Dr. J.M. Juran started applying this principle to defect analysis, separating the "vital few" from the "trivial many," and called it the "Pareto chart.” This is often referred to as the 80-20 rule, as 20 percent of the issues cause 80 percent of the problems, or a relatively small number of issues account for an overwhelming share of the problems.
The Pareto chart shows the relative frequency of defects in rank order, allowing one to organize reliability efforts to "get the most bang for the buck" or "pick the low-hanging fruit."
You can generate a Pareto chart using virtually any spreadsheet or charting software. The chart in Figure 8 shows the results of an actual Pareto analysis. Fixing the first item in the chart decreased maintenance expenditures by more than $1 million per year and most importantly allowed maintenance resources to be used for other reliability work. The first five items in the chart resulted in $18 million in increased revenue per year.
The Pareto chart is a simple-to-use and powerful graphic to identify where most problems in a plant originated. It won’t help with catastrophic failures but is an extremely useful tool for finding the chronic problems that over time consume as much of reliability and maintenance resources as catastrophic failures.

Figure 8. Pareto chart
Data Analytics
In manufacturing and process industries, the Internet of Things (IoT) or data analytics is an application of statistical methods to process data. Data analytics in failure analysis is typically confirmation or disproving of an existing hypothesis or discovering new information in the data.
Data analytics is a process of inspecting, cleansing, transforming and modeling data with the goal of discovering useful information, suggesting conclusions and supporting decision-making (Figure 9).

Figure 9. Data science process flow chart from "Doing Data Science" by Cathy O'Neil and Rachel Schutt
When one hears about “big data,” Google, Facebook, Amazon, Apple and other consumer companies come to mind, as organizations that gather enormous amounts of data about us and through data science use it to predict how we will behave in the future. Targeted ads are just one example.
In manufacturing and process industries, the situation is different. The development of wireless sensors has enabled us to inexpensively collect vast amounts of data. We can quickly gather process data and use statistical methods to confirm or discover new relationships in our factories and plants. A decade ago, monitoring a process variable, such as temperature, required installation and wiring a temperature RTD with power and a connection back to a PLC or DCS so data could be captured. Now, it is possible to install a self-powered RTD and transmitter with a wireless data link to the IoT.
A variety of statistical tools can be applied to the data to confirm or refute hypothesis or discover new relationships between process variables. This ability adds a powerful tool to a root cause analysis, particularly of functional failures. Depending on the data quality in maintenance history, it is also possible to discover hidden relationships within the maintenance data using text analytics.
The number of people employed in industry is shrinking. Experience and knowledge is walking out the door in the form of retiring baby boomers. Data analytics shows promise to help close the gap between a shrinking knowledge base and the need for better root cause analysis. In the world of mechanical failure analysis, a gap between the need for spectral vibration data and data analytics still exists. Overall vibration levels can be processed, but data analytics software has considerable room for improvement in the treatment of spectral vibration data.
In the next decade, you can expect to see an accelerating shift toward smart instruments, the IoT and data analytics. For example, think how a control valve positioner can automatically calibrate and configure itself, do diagnostics to maintain loop performance levels, improve control accuracy to reduce process variability, and tell you about it.
Pitfalls in Root Cause Analysis
There is a strong temptation to place blind faith in particular root cause analysis models. After all, they have been proven to work, and why reinvent the wheel? Predefined structured processes can save valuable time. However, it is important to remember that the answers may lie outside a chosen process. Models can be useful because they help strip away unimportant data. If we use models without knowledge of their assumptions and limitations, we may miss important facts and misdirect our analysis.
Do not try to include too much in your analysis. The temptation is strong to add in every possible cause even when they are not necessary, sufficient or present to cause an effect. Remember, inclusivity does not guarantee you are effective or correct.
Verify all the evidence and hypothesis. It is very easy to take the wrong path if a hypothesis is wrong. Be aware that just because the boss has a hypothesis, it isn’t necessarily correct.
Deciding where to start and how you describe the failure has an enormous impact on the time effort and outcome of your investigation. Starting with a functional failure when there has been environmental impact, injury or substantial cost helps with the discovery of the human and organizational root causes that with few exceptions are present and play significant roles in the failure. When a failure does not result in environmental, injury or significant expense, beginning at the component level helps streamline the analysis and typically makes identification of the physical roots easier. As the analysis progresses, the degree of investigation into human and organizational causes can be balanced against the level of risk and cost acceptable to you and the organization.
Making It Happen
Ideally, it would be nice to have a full complement of root cause analysis tools in your plant. Choices must be made because one doesn’t have unlimited time and money. The choices become easier to make if one takes a moment to consider where the need is, how often a root cause analysis will be needed, and what resources are available. If the need is greatest for functional failures or product quality and efficiency problems, the tools used will be different than those used for component failures. If you are reading this article, it is reasonable to conclude your focus will be on component failures. Table 1 summarizes the time required.

Identifying and understanding the root causes of component failures is best when started on the shop or production floor. Technicians and front-line supervisors who can identify physical failure modes and use basic but powerful analysis tools are often the best means to prevent failures from happening in the future. Technicians and front-line supervisors would have the following skills:
-
Five whys – Learning five why analysis can be done in less than a day. The CMMS must be able to support what is learned from a Five Why analysis either with failure modes or a means to capture causes.
-
Ishikawa/fishbone diagram – This also can be taught in less than a day. It introduces people to a broader cause and effect analysis to identify effects that may have multiple causes.
-
Barrier analysis – An introduction to barrier analysis helps shift culture from simplistic solutions to the concept of risk and risk reduction.
-
Causal factor tree or fault tree analysis – Not everyone needs to be able to construct a tree, but they should be able to participate in the development of one when led by a facilitator. People closest to the point of action have information and insights that are frequently vital to identify root causes and more importantly make changes to prevent future failures. Training to introduce people to either causal factor or fault trees typically takes one day to complete.
-
Failure mode identification – This is frequently considered as a subset of the root cause analysis methods. Frequently, incorrectly identified failure modes lead analysis efforts astray. Technicians, front-line supervisors and reliability engineers must be able to correctly identify physical failure modes. This training takes four days to complete. It also helps a Pareto analysis because failure modes are correctly identified.
In every plant, there should be at least one person who has received facilitator training on causal factor or fault tree analysis and change analysis. This helps ensure consistency and reinforces the use of root cause analysis. Vendors of these methods frequently tout their system as superior to others. They all have certain strengths and weaknesses. Causal factor and fault tree analysis are very similar, so having both may lead to confusion. It is important that one is selected and used. Training for each of these methods usually takes four or five days to complete.
Reliability engineers should receive training on the following:
-
Five whys
-
Ishikawa/fishbone diagrams
-
Cause and effect/causal factor tree
-
Fault or logic tree
-
Pareto chart
-
Change analysis
-
Statistical methods - If they are involved in production issues, training on statistical methods including data analytics should be included.
Unless there is personal injury, an environmental accident or a large cost involved, don’t start every effort with an expensive analysis. You can often be more effective by using the five whys, Ishikawa/fishbone or a simple cause and effect analysis to solve many problems. A situation appraisal may help you select another method when it appears the problem can be solved with a simpler method. Causal factor trees, fault or logic trees can take a substantial amount of time to complete. This can range from a day to several weeks. Failure mode and effect analysis takes weeks or months to complete.
Additional Resource
A resource you may find useful for additional information on root cause analysis:
The Rootisseriet. This website has a wealth of articles on root cause analysis as well as links to additional resources.