Using Thermography to Uncover Hidden Problems
Tags: condition monitoring, infrared thermography
Thermography can be used to identify and analyze thermal anomalies for the purposes of condition monitoring of machines. These thermal anomalies are usually caused by such mechanisms as operation, improper lubrication, misalignment, worn components or mechanical loading anomalies.
Infrared thermography is based on measuring the distribution of radiant thermal energy (heat) emitted from a target surface and converting this to a surface temperature map or thermogram. Thermal energy is present with the operation of all machines.
It can be in the form of friction losses within machines, energy losses within machines, as a characteristic of the process media or any combination thereof. As a result, temperature can be a key parameter for monitoring the performance of machines, the condition of machines and the diagnostics of machine problems.
Temperature is also one of the key causes and symptoms of lubricant degradation and loss of lubrication function within a machine.
Infrared thermography is an ideal technology to investigate thermal anomalies on machines because it offers complete thermal images of a machine or a machine component with no physical attachments (non-intrusive), requires little setup and provides the results in a very short period of time.
As such, thermography techniques can be used as part of a condition monitoring process when such a process is implemented in accordance with ISO 17359.
Thermography Techniques
There are several recognized infrared thermography techniques in use throughout industry. Comparative thermography is the most common technique, and it is normally used to provide the best available data in lieu of ideal or absolute thermal measurements.
When encountering changing machinery operating conditions, the ability to perform rough emissivity estimates and to differentiate emissivity differences on machinery equipment provides useful information for condition monitoring and diagnostics of the machine under the less-than-ideal circumstances frequently encountered in the field. Absolute thermography is used when it is essential to know as precisely as possible the true temperature of a target.
Comparative Thermography
Comparative thermography can be either quantitative or qualitative. The quantitative technique requires the determination of a temperature value to distinguish the severity of a component’s condition. This value is determined by comparing the target’s temperature to that of similar service equipment or baseline data.
Although the temperature value is not exact, it is reasonably close to actual. More importantly, the temperature differentials are accurate. However, there are many applications where quantitative data is not required to monitor the condition of machinery or to diagnose a problem and recommend the appropriate corrective action. In these cases, qualitative techniques may be more than adequate.
Comparative Quantitative Thermography
The comparative quantitative thermography method is an effective method for evaluating the condition of a machine or component by comparing approximate temperature values between identical items, reference values or baselines.
The determination of precise actual temperatures of a component, using infrared thermography in the field, is considered very difficult to obtain. This is due to a certain extent to the physics of infrared thermography, which must take into consideration the multiple parameters that enable a true absolute temperature measurement.
These considerations are emissivity, reflectivity and transmissivity. As a result, estimates of these considerations can be readily made to obtain a component’s approximate temperature, which in most cases is more than sufficient to determine the severity of an adverse condition.
Since it is not always practical to determine the exact temperature or even emissivities of each machine component, the alternative use of comparative thermography becomes more practical. Comparative measurement, unlike qualitative measurement, identifies a thermal deficiency by comparing the temperatures obtained using a consistent emissivity value.
The temperature differential between two or more identical or similar components is measured numerically. Assuming that the environmental conditions for both components are similar, the differential temperature for the given piece of equipment is recorded as being the amount above the normal operating temperature of the similar equipment.
An example of comparative quantitative thermography would be that, if two or more machines are operating in the same environment and under the same load conditions, and one is experiencing an elevated temperature, this is usually an indication that a deteriorating condition may exist. However, the determination of the temperature difference would then assist in establishing the severity of the condition.
In this example, a 5-degree C differential would be considered minor, whereas a 100-degree C differential may be considered to be critical. Also, knowing the approximate value of the elevated temperature would provide an indication that the temperature limit of a component may be approaching alarm values.
Therefore, while qualitative measurements can also detect deficiencies, it is the quantitative measurements that have the capability of determining severity.
Comparative Qualitative Thermography
Comparative qualitative measurement compares the infrared pattern, such as gear contact patterns, of one component to that of an identical or similar component under the same or similar operating conditions. When searching for differing thermal patterns, an anomaly is identified by the intensity variations between any two or more similar objects, without assigning temperature values to the patterns.
This technique is quick and easy to apply, and it does not require any adjustments to the infrared instrument to compensate for atmospheric or environmental conditions, or surface emissivities. Although the result of this type of measurement can identify a deficiency, it does not provide a level of severity.
This infrared thermography technique is used throughout most industries. It is very effective in identifying hot bearings or other abnormally hot machine components, hot spots in electrical equipment, undesirable hot electrical connections, leaking or even clogged fluid heat-exchange equipment and its components (tubes), and fluid leaks from pressure vessels, pipes and valves.
Thermometry
The determination of the absolute temperature of a target using infrared thermography is very difficult to obtain because of the many technical and environmental factors involved. As a result, absolute infrared thermography measurements are done only if very precise temperature values or small temperature differentials are critical to a process.
These determinations are normally attempted only under extremely controlled laboratory type conditions. This type of measurement is not normally used for condition monitoring.
Baseline Measurements
It is strongly recommended that baseline measurements be taken of critical plant equipment. This is very important when making later infrared thermography surveys of machines or components and comparing them with previous thermograms of the same machines operating under the same load and environmental conditions.
This condition monitoring procedure is useful for early identification of developing problems, thus preventing major maintenance operations or catastrophic failures.
Assessment Criteria
When applying infrared thermography to condition monitoring and diagnostics of machines and their related components, it is recommended that severity criteria be established.
Severity criteria can take two forms: they can be organized into general categories that identify temperature levels or zones (versus levels of criticality), and they can be applied to specific machines or components, or to like groups of machines or components. In either case, the levels are established through experience and the accumulation of data.
In practice, no singular acceptance criteria is universally applicable to the variety of items and applications existing in industry. Consequently, severity criteria must be developed for each category of equipment based upon its design, manufacture, operation, installation, maintenance characteristics, failure modes and criticality.
Severity criteria can be established on individual machines or components. This method is based on many factors, including temperature rise vs. historical data that establishes rate of deterioration and time to failure, criticality of the machine or component to the overall process, location with respect to other materials/equipment should a fire result, safety of personnel, environmental conditions, etc.
Applications could include temperature rises of critical machines, mechanical components, bearing temperature rises, electrical supply or connection rises, fluid leakage losses or even the number of tubes clogged in fluid heat-transfer-type equipment.
The infrared thermographer may use temperature difference criteria or classify the temperature severity of mechanical system anomalies. These criteria are usually reported as the temperature rise of the exception above the temperature of a defined reference.
By taking multiple measurements over time of similar components under similar operating and environmental conditions, statistical analysis can be used to set operational limits for trending and predicting the temperature performance of these components.
This type of system may be used in conjunction with these absolute temperature criteria to rate the temperature severity of an exception above the maximum allowable temperature.
Relative Temperature Criteria
An example of a set of severity criteria based on categories and temperature rises above established references is as follows:
ADVISORY Up to a 10-degree C rise above a reference or baseline
INTERMEDIATE 10-degree C to 20-degree C rise above a reference or baseline
SERIOUS 20-degree C to 40-degree C rise above a reference or baseline
CRITICAL In excess of a 40-degree C rise above a reference or baseline
Reference temperatures should be based on temperatures specified by manufacturers of similar items or groups of equipment, or of components located on the same shaft. Baseline temperatures should be based on historical or statistically derived temperatures established from the specific item or machine groups when in the “ideal” condition.
Absolute Temperature Criteria
The infrared thermographer may use absolute maximum allowable temperature criteria based on published data to identify mechanical system anomalies. There are two categories of criteria: material and design.
Material criteria are used where the integrity of the material itself is of concern and is the focus of monitoring. Design criteria are used where the design integrity is the major concern and is the focus of the monitoring.
Design criteria should always be used in preference to material criteria, since design criteria normally incorporate material requirements. Design criteria are usually cognizant of performance, operation, reliability and capacity criteria rather than just component material integrity.
When heating several adjacent system components and a material criteria is used, the component material having the lowest temperature specification should be referenced as the alarm criteria.
In most machine cases, the lubricant will have the lowest temperature specification. The maximum allowable temperature should be stated as the temperature above which an unacceptable loss of component life will be experienced due to a loss of lubricant characteristics.
Such reductions in characteristics may be immediate (viscosity) or long-term (additive depletion). Such criteria will tend to be design rather than material based. This will require application-specific temperature criteria despite the possible use of common lubricants.
In many instances the infrared thermographer cannot directly measure the surfaces of actual components. Care and good judgment must be used when applying any severity specifications to actual field temperature measurements, taking into account conduction paths, convection and radiation.
Profile Assessment Criteria
Profile assessment is a process of comparing temperature differences and patterns across a surface. As in any severity-assessment process, the absolute and differential temperatures and profiles need to be determined for two key conditions: “as new” and “failed.” Severity assessment is the subsequent process of determining the condition of the equipment between these two conditions.
The key areas of profile assessment are temperature gradients, changes in profile, historical changes, localized differences, absolute temperatures, location of anomalies or profile characteristics relative to the item.
Survey Intervals
Survey intervals should be determined with knowledge of the rate of deterioration of the expected fault and the behavior over time of temperature as a representative symptom of the fault. The determination of the survey interval is primarily necessary for prognosis accuracy rather than fault identification.
Image Interpretation
From a machinery viewpoint, thermal image interpretation essentially is a process of comparing absolute temperature and temperature profiles against design, manufacture, installation, operation and maintenance criteria.
When using thermography for machinery condition monitoring purposes, the operating conditions at the time of each survey should be known in detail, as many changes in thermal profile are operating-condition dependent. The design of a machine is essential to understanding component loading, which in turn is the primary contributor to thermal profile.
When using thermography to assess machine condition, it is important that the machine is viewed as a whole and that each image is analyzed as part of a series rather than as an individual representation of a localized condition.
Thermal imaging is a very powerful correlation technique for other condition monitoring methods. It is exceedingly useful for assisting with solving lubrication issues that are temperature-related, as it can pinpoint location, source and extent of the influencing thermal anomalies, as well as determine the effectiveness of circulation, control and cooling systems.
Knowledge of design, manufacturing, installation, operation and maintenance-induced failure modes and their thermal symptoms is paramount to successful machinery investigation and solution design using thermal imaging. This knowledge is of far greater importance than specific knowledge of the technique, its applications or its limitations.
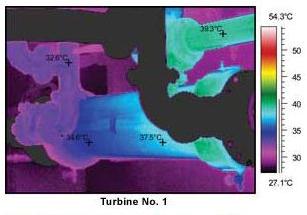
Case Study: Mill Drive Train Misalignment
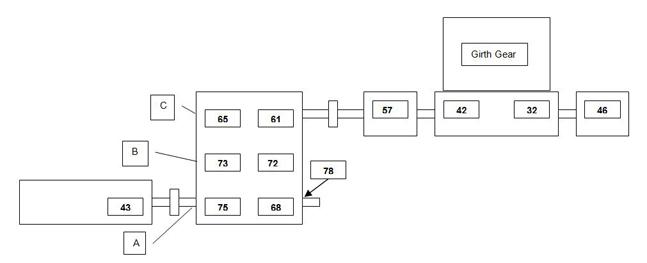
A recent case study involved a grinding mill drive train in a gold mine consisting of a motor, a three-shaft reduction gearbox, two pinion bearings and a pinion gear. All bearings were rolling element types with the mill drive pinion gear bearings being double row spherical roller bearings.
The following temperatures were recorded:
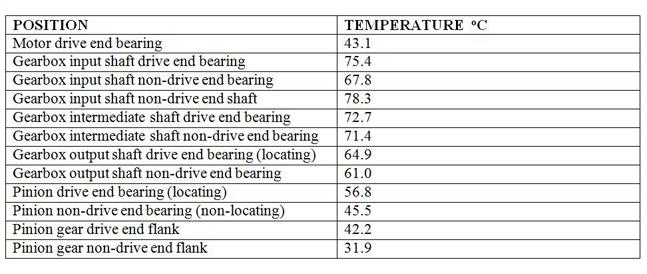
Motor Bearing Gearbox Bearing Mill Drive Pinion Gear
The temperature of the gearbox intermediate shaft (B) normally was expected to be slightly higher (1 to 2 degrees C) than the high-speed shaft (A) and moderately higher (3 to 5degrees C) than the slow-speed shaft (C), as it was in double mesh at any one time and received more heat input.
In this case, the average temperature rise was approximately 8.5degrees C above the low-speed shaft and approximately 3.5degrees C above the high-speed shaft, which was considered above normal.
The above temperatures and profiles were indicative of a misalignment between the motor and gearbox, a misalignment between the gearbox and the mill drive pinion, and a misalignment between the mill drive pinion gear and driven girth gear.
The combined motor to gearbox and gearbox to mill drive pinion misalignments resulted in a loss of end float within the gearbox, trapping the intermediate shaft gear. The 10.3-degree C temperature difference across the mill drive pinion gear was also considered excessive and indicative of severe pinion to girth gear misalignment.
The misalignment conditions, gear loading and bearing distress were all confirmed using vibration analysis. Subsequent overhaul and re-alignment of the drive train reduced the temperatures to acceptable conditions.
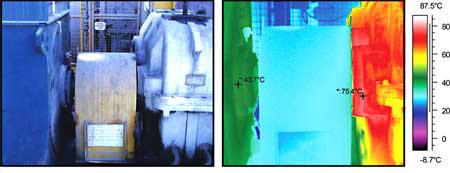
Figure. 1 Motor and Gearbox Input Shaft
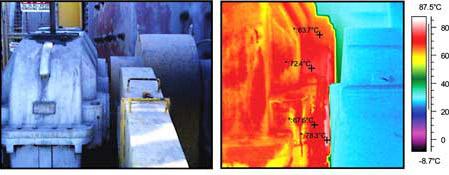
Figure 2. Gearbox Input Shaft Side
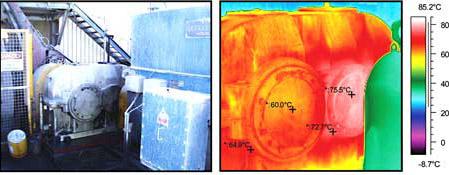
Figure 3. Gearbox Motor Side
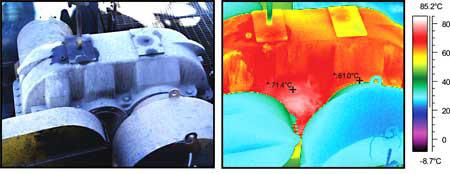
Figure 4. Gearbox Mill Side
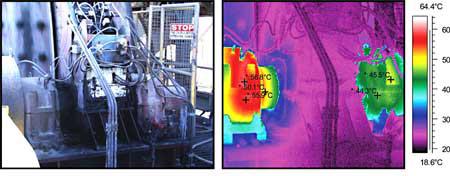
Figure 5. Pinion Bearings and Mill Drive Pinion Gear Housing
Case Study: Turbine Oil Coolers
Two turbine oil coolers of identical design demonstrated that one of the turbines had an oil cooler problem. Insufficient thermal evidence existed to determine whether the problem was related to oil flow, water flow or both, given that both machines were operating at identical loads.
Under identical loads and oil conditions, turbine No. 2 operated with consistently higher vibration due to the effects of reduced oil viscosity resulting from higher operating temperatures.