Value Stream Mapping: A Complete Guide
Tags: value stream mapping
Value Stream Mapping is used to analyze the current state and design a future state for the process that takes a product from start to finish with as little waste as possible.
What is Value Stream Mapping?
Value stream mapping is defined as a lean-management tool for analyzing the current state and designing a future state for the process that takes a product or service from its inception to the customer, minimizing as much waste as possible. Put simply, it lets you review the steps within the process that takes your product from start to finish, so you can discover ways to cut waste and make the process as lean as possible. Reducing waste and making your process as lean as possible increases efficiency and productivity while also allowing waste to be more easily identified. Value stream mapping is part of the Six Sigma methodology for going lean.
Value stream mapping uses a flowchart with a series of standardized symbols to denote various work streams and information flows. Each item listed in the process is viewed through the customer's point of view and mapped as adding value or not adding value; the purpose being to root things that don't add value. Standard value stream maps are drawn with value-adding steps across the center of the map, while non-value-adding steps are drawn as vertical lines at right angles to the value stream. This makes activities easily separated into the value stream.
Value stream mapping can be applied to any process that has repeatable steps and multiple handoff points. In a manufacturing process, these handoffs are fairly easy to identify since they involve tangible things physically changing hands. For example, it's fairly easy to visualize procurement ordering spare parts, the parts being shipped from the manufacturer to the plant, the plant receiving the spare parts and storing them, and so on.
We've already eluded to one benefit of value stream mapping, but let's take a look at how it can help your organization's sustainability, as well as go over a few challenges it can present. The benefits include:
- Improving your organization's bottom line by reducing or eliminating waste and discovering the root cause or source of the waste.
- Visualization is an effective communication tool. After sources of waste have been identified, your organization can standardize improved behavior, communication and collaboration.
- Individual opinions are set aside, and priorities are centered around the customer's perspective.
- In addition to eliminating waste, value stream mapping can add value as well. Getting rid of waste is the means to an end of adding value. Things like being able to offer a lower price and/or a better-quality product add value to your customers.
Value stream mapping can be a wasteful activity if you're not careful. To avoid this, take note of the following considerations:
- Ensure you balance the amount of effort it takes to conduct value stream mapping with the potential value or savings it provides. In other words, keep the return on investment (ROI) at the center of your focus.
- It's important to have experienced employees from all departments involved in the value stream mapping process, since maps can be very cross-functional and complex.
- Start small. Even though small improvements won't always offer a huge amount of savings upfront, they often translate into savings on the bottom line once a full walkthrough is complete.
- Keep it simple. Don't try to use professional map templates and symbols at the beginning. It's OK to sketch out a rough draft on a whiteboard or to use pencil and paper and then formalize the map once things become clearer.
Remember, overdoing it and making it more complicated than it should can be problematic. You're trying to reduce waste, not create more. If you're unsure about value stream mapping, you can even try one on a budget for a simple overall review of your process. This can help you better grasp the concept and could even translate into results.
Which Symbols Are Used in Value Stream Mapping?
Value stream maps use a series of standardized symbols to ensure everyone is on the same page and speaking the same language. These symbols are broken down into four categories: process symbols, material symbols, informational symbols and general symbols. Let's take a look at them and define what each one represents.

These are the most commonly used symbols found on a value stream map. Most people print them and create a symbols chart for quick reference until they are memorized.
How to Conduct a Value Stream Analysis
Before you start the process of actually creating a value stream map, spend some time observing your company's processes so you can visualize it later. As you prepare for value stream analysis, keep these tips in mind:
- Discuss the goals with key leadership and consider these goals as you start the process of analyzing your processes. Your goals should be focused around three criteria for value-adding activities: the customer wants you to do it, material is processed into final products, and it's done correctly the first time.
- Physically observe the process and gather data. Ask employees to walk you through their existing process and how they get things done each day. Many process engineers like to start at the end of the process and work their way back to the beginning. Record things like the time it takes to complete each step and any inefficiencies you notice during that time. Take note of the number of workers, number of working hours, machinery uptime and downtime, etc.
- Focus on the current state initially. Once you've demonstrated where the issues are, you can create the current state value stream map, showing how things are working now, before moving onto the ideal future state.
How to create a value stream map
You've observed your organization's process, and your team is ready to create a current state value stream map. Below, we'll break down each step, but the basics are as follows:
- Figure out the scope of your value stream map
- Map out each step of your process
- Add inventory and wait times to the map
- Draw information flow
- Create a timeline
Step 1. Outline the scope of your value stream map
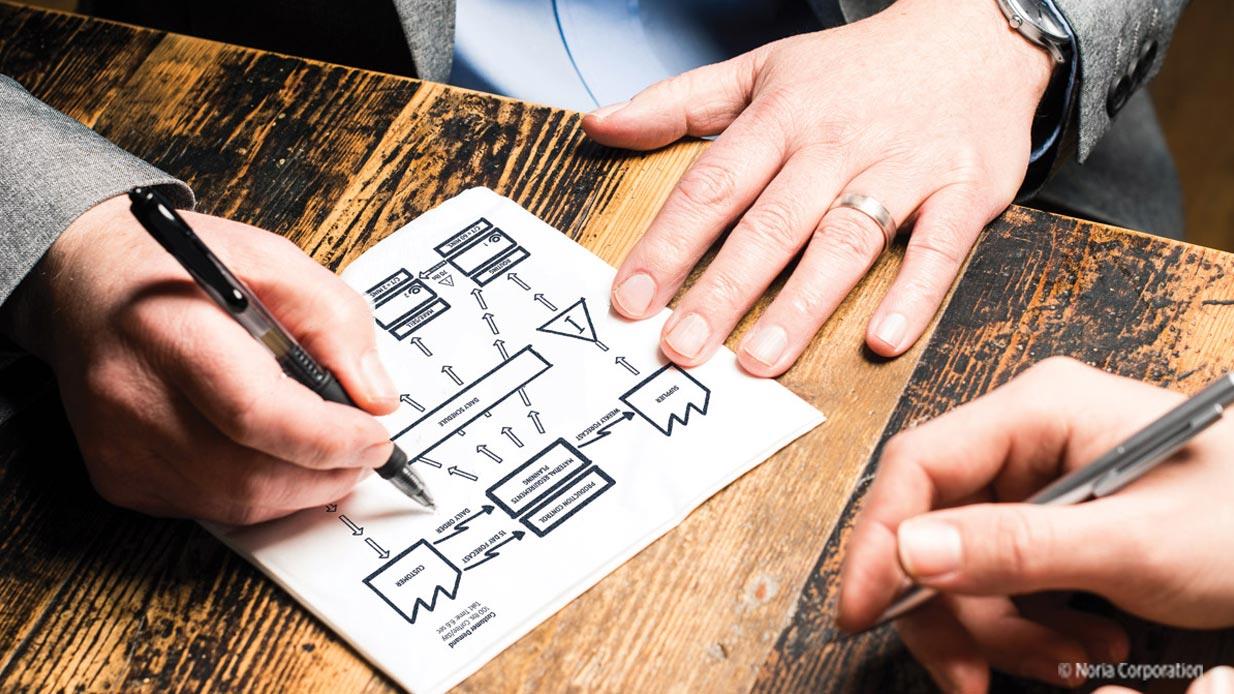
List your start and end points by placing them in the upper-left (start) and right (end) corners of your map. For example, if you're looking at your supply chain, you'll most likely start with your supplier (raw materials) in the upper-left corner and end with the customer in the upper-right corner. Next to the customer, write out the takt time — the maximum amount of time you can spend and still satisfy the customer. This is calculated by taking the available production minutes and dividing it by the number of units required for production. For example, imagine you own a coffee-roasting company and need to roast 100 pounds of coffee a day to meet demand. Considering it takes about an hour to roast 100 pounds of coffee, the takt time would be 0.6 seconds (60 minutes / 100 pounds of coffee = 0.6 seconds).

Step 2. Map out the steps of your process
Using the dedicated process symbols, add process boxes to show every step involved. Place a small circle with a number inside denoting the number of operators who work on this step in the process. As you can see from the example below, one person roasts the coffee beans, two people bag the coffee and prepare it for shipping, two people sell/make coffee at the counter, and one person makes wholesale deliveries.
Under each process box, add a correlating data box that contains your analysis (the "other information symbol"). Data you may want to include in these boxes might be things like the time it takes to complete one unit (cycle time), the time it takes to switch the type of product (changeover time), uptime, and yield.
Make sure you limit the number of process boxes to keep the map focused and at the appropriate level or scope. Limiting process boxes to 10-15 steps is an acceptable number. You can always create another value stream map for other processes with their own set of 10-15 steps.

Step 3. Add inventory and wait times
You now can use arrow symbols showing process flow to connect your start and end points; in this case, your supplier to your customer. Arrows comprised of a thick, solid line generally denote shipments. In our example, the supplier ships coffee beans to the coffee roaster, which ships coffee to the customer. You can use "push arrow" symbols to indicate how materials are moved from process to process.
Between each stage, use the inventory triangle symbol to show the number of parts/materials you have at the end of each step. You can even add a truck, airplane or other equipment symbols on shipment arrows to denote the mode of transportation.

Step 4. Draw the flow of information
It's now time to illustrate the flow of information within the production process. Add production control box symbols to show who is scheduling and controlling production. Production control boxes are generally placed between the start and end points. Be sure to include the responsibilities of the person or group in the lower portion of the box.
Once your production control boxes are in place, add the lines of communication. Use jagged lines to denote electronic communication like email or phone and straight lines to show manual communication such as memos, printouts or physical conversations. Add detail boxes with information like what information is exchanged, how often the information is exchanged, and the media used.
Below, you can see how the manager of the coffee-roasting company receives customer orders and sends weekly forecasts to the supplier electronically via email. The daily schedules and tasks are delivered to in-house employees in person.

Step 5. Create a timeline
The timeline is the most important aspect of your value stream map when it comes to detecting areas of waste within your process. A timeline has two levels – a top and bottom. The bottom level contains the times for value-added processes (taken from the data boxes on your map). The top level includes non-value-added processes.
In our example, you can calculate the non-value-added times based on the inventory you record to account for overproduction. Your customers demand 100 pounds of roasted coffee a day, so 100 pieces count as one day of non-value-added time. At the end of your timeline, you should include a data box that summarizes this information. This data box should include:
- Production lead time – the total non-value-added time from the top half of the timeline
- Value-added time – the total value-added time from the bottom of the timeline
- Process cycle efficiency – the percentage of value-added time taken from the production lead time

Future state value stream map
Once you have a good visualization of the current state of your process, you can start to create a future state value stream map – one that lays out what the process could look like once waste is eliminated. A few things to consider when planning your future state map include:
- Where are the bottlenecks? From the current state map, look at things like processing times and cycle times. If these data points are greater than your takt time (how frequently a part must be produced to meet demand), you have a bottleneck. This might be a symptom of overproduction or extra processing time like overtime.
- Where can inventory be reduced? It may be beneficial to implement a "supermarket" system – a controlled inventory system where the downstream process takes items from the "shelf" and the process owners upstream restock items to the "supermarket." Consider things like raw material, work in progress (WIP), buffer stock and safety stock to see where inventory can be reduced and whether it makes sense to implement a "supermarket."
- Where can flow be improved? Look for areas where you can improve flow. Are there ways you can keep materials from stopping and waiting? Could you benefit from a first-in/first-out lane in your process?
Helpful Tips for Conducting Value Stream Mapping
- Pick important processes. This means you should select value streams that align with your strategic plans or annual goals. You must understand your customers and know what they require to be clear about the value streams through which you're delivering the product to these customers and how well those streams are performing.
- Group jobs into process families. Grouping jobs into process families allows you to achieve better flow. For example, if you have multiple process steps, look at whether any of these steps could be combined, making it easier to produce the product at a lower cost.
- Walk the process. This was mentioned in the first step of creating a value stream map, but it's important to visualize the process and see how things are done firsthand, as opposed to just hearing about it from an employee or reading about it on a spreadsheet. Use a stopwatch and time various steps to obtain accurate data. Ensure you or another person on your team walks the entire process, rather than having different people walk different parts of the process.
- Work backward. Looking at a process from the end product to its origins can give you a fresh perspective on how a product is made.
- Sketch an initial map by hand. Using a whiteboard or pencil and paper is a great way to start laying out a process. It's easy to erase and correct mistakes or add and subtract information from team members. Once you have a rough draft of your value stream map, you can finalize it using chart-drawing software.