×


Chart: Import and export prices by month since November 2009
U.S. import prices increased 1.3 percent in November, following a 1.0 percent advance the previous month. Rising prices for fuel and nonfuel imports contributed to both the November and October increases. Prices for U.S. exports also rose in November, increasing 1.5 percent after advancing 0.8 percent in October.
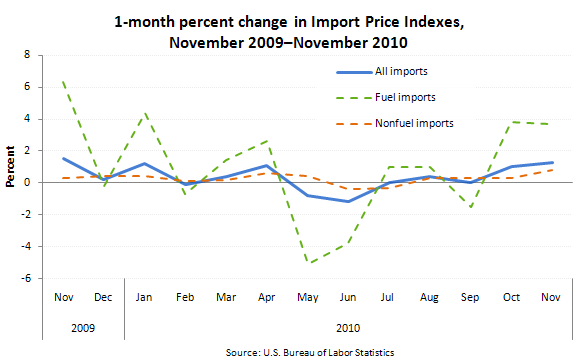
Import prices advanced 1.3 percent in November following a 1.0-percent increase in October. The November rise was the largest monthly advance since a 1.5-percent increase in November 2009 and marked the first time since May and June 2009 that import prices rose by at least 1.0 percent in consecutive months.
In November, fuel prices rose 3.7 percent after advancing 3.8 percent the previous month. The November increase was driven by a 4.1-percent rise in petroleum prices, which more than offset a 3.8-percent drop in natural gas prices.
Prices for nonfuel imports rose 0.8 percent following 0.3-percent advances in each of the three previous months. The November increase was the largest one-month advance for the index since a 1.1-percent rise in April 2008. Higher prices for nonfuel industrial supplies and materials were the largest factor for the overall increase in nonfuel prices. Increasing finished goods and food prices also contributed to the November advance.
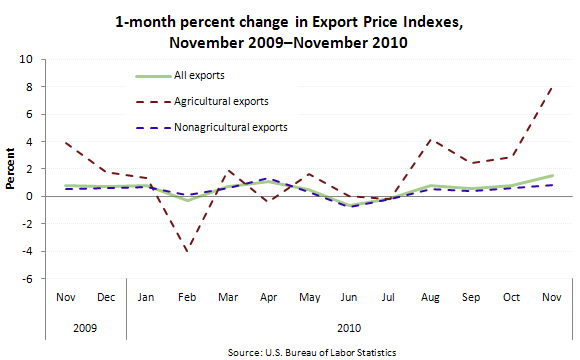
Export prices increased 1.5 percent in November, the largest monthly advance for the index since a 1.5-percent rise in July 2008. Prices for both agricultural and nonagricultural exports continued to move higher.
In November, prices for agricultural exports rose 8.0 percent, the largest one-month jump in the index since publication began on a monthly basis in December 1988. Higher prices for corn, cotton, soybeans, and wheat all contributed towards the increase in agricultural prices.
The price index for non-agricultural exports advanced 0.8 percent, the largest monthly increase since a 1.3-percent rise in April. Prices for both non-agricultural industrial materials and finished goods contributed to the November increase.
This data is from the BLS International Price program. Import and export price data is subject to revision. For more information, see "U.S. Import and Export Price Indexes — November 2010" (HTML) (PDF), news release USDL-10-1689.
