×


Chart: Import and export price indexes since September 2009
Over the 12-month period from September 2009 to September 2010, U.S. import prices rose 3.5 percent, the smallest increase on a 12-month basis since a 3.4-percent advance for the November 2008-2009 period.
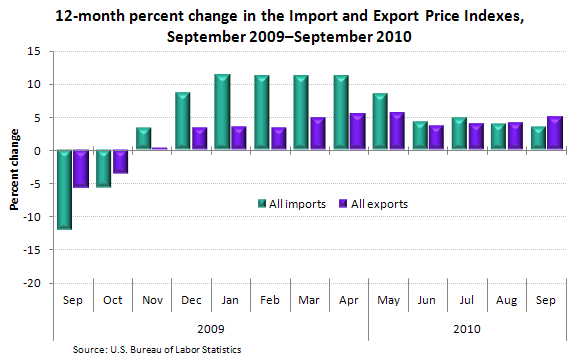
The price index for overall exports advanced 5.0 percent for the year ended in September, the largest year-over-year increase since a 5.6-percent rise for the May 2009–2010 period.
In September, falling prices for both petroleum products and natural gas, down 3.1 percent and 4.4 percent, respectively, contributed to the overall decline in fuel prices. Despite the September decrease, fuel prices rose 7.1 percent over the past 12 months.
Prices for agricultural exports rose 2.4 percent in September after a 4.1-percent advance the previous month. The September increase was led by higher corn prices, up 10.4 percent, and a 9.5-percent rise in wheat prices. The price indexes for corn and wheat were up 5.1 percent and 31.1 percent, respectively, in August. Rising corn and wheat prices also contributed to the 12.1-percent increase in agricultural export prices over the past 12 months.
This data is from the BLS International Price program. Import and export price data are subject to revision. To learn more, see "U.S. Import and Export Price Indexes — September 2010" (HTML) (PDF), news release USDL-10-1424.
